
| Welcome to the March issue of the Select Wealth Management Dashboard Newsletter. It's been a wild month in share markets since last I wrote. The S&P500 (American share market) entered "correction" territory on the 11th of March. A "correction" is defined as a fall of 10% or more from the most recent high. On 19th February, the S&P500 closed at 6,144, and by 11th March, it had fallen to 5,528 - a 10% decline.
Not only did we have a correction, but it was a violently quick one too. This 10% decline was the 5th fastest in the past 75 years, ranking just behind 2020's covid crash, 2018's trade war sell-off, Eisenhower's heart attack in 1955 and the beginning of the Korean War in 1950. (Interestingly, Donald Trump has been president for 3 of these 5 fastest corrections.) This sort of market volatility can be extremely unsettling for investors. It's a true test of your risk tolerance. Before you place an investment anywhere (KiwiSaver, a bank, through Sharsies, through a stock broker), you are typically encouraged to complete some sort of "risk profile questionnaire" - a series of questions aiming to understand how much risk you are comfortable with to ensure that you end up in a suitable investment. Ours has 7 multi-choice questions, asking about how long you intend to invest for, whether you consider yourself a conservative or aggressive investor, etc. You know the drill - I've probably forced you to do it a dozen times! We also outline what returns you can reasonably expect from various investment risk profiles over any given 1; 5 or 10 year period. For example, for a Balanced Portfolio (a "# 5" risk on a spectrum of 0 to 10), we believe you can expect the following outcome for every $100,000 invested after a 1 year period:
This implies that, on average, you can expect your $100,000 to grow to $104,200 (after all fees and tax at the highest rates) by the end of a year - a return of 4.2% per annum after fees and tax. However, 1 in every 20 years, your investment could fall in value by up to 11.5% (to $88,500) or grow by up to 19.4% (to $119,400). Most of us seem very comfortable with this level of risk when we are completing the risk profile questionnaire. We read the information, absorb it, understand it, work out in our own minds if we could weather the bad case scenario losses in the unlikely event they occur. And then in a rational frame of mind, we tick the box and make a decision to take on this risk. It meets our goals, is appropriate for our circumstance, and suits our risk appetite. But in reality, when market volatility hits, rationale and common sense are often replaced by emotion and panic. Risk was simply a concept when we were completing the risk profile questionnaire. Now it's a reality. Markets are falling, and every time we turn the telly on, it tells us that the sky is about to fall. Taking no action at all does not seem like an option. Fight or flight kicks in, and the natural response is to do something. Anything. It is at times like these that I remind myself to go back and look at the original risk profile questionnaire that was completed by the rational me. If my circumstances haven't changed, then my risk profile shouldn't have changed either - irrespective of what's happening in the markets. I can also apply some logic and back test my actual Balanced Portfolio's returns against the expected return. And when I do this, I would realise that despite this recent correction, the return over the past year has in fact been just over 4.2% after fees and tax - an above average year's performance. So my objectives haven't changed, and the portfolio has delivered the return I would expect over the past 12 months. That tick's those two boxes. Now the million dollar question - what's going to happen over the next 12 months. Well, the answer of course is that nobody knows. But history has given us a few clues. The following table outlines the performance of the S&P500 for the 12 months immediately after a correction of 10% or more since 2010. There are 2 points to note. Firstly, 8 of the nine previous corrections have resulted in positive performance in the following 12 months. Secondly, the average return is 18% - nearly double the long term average return of the S&P500 (which is 10% per annum).
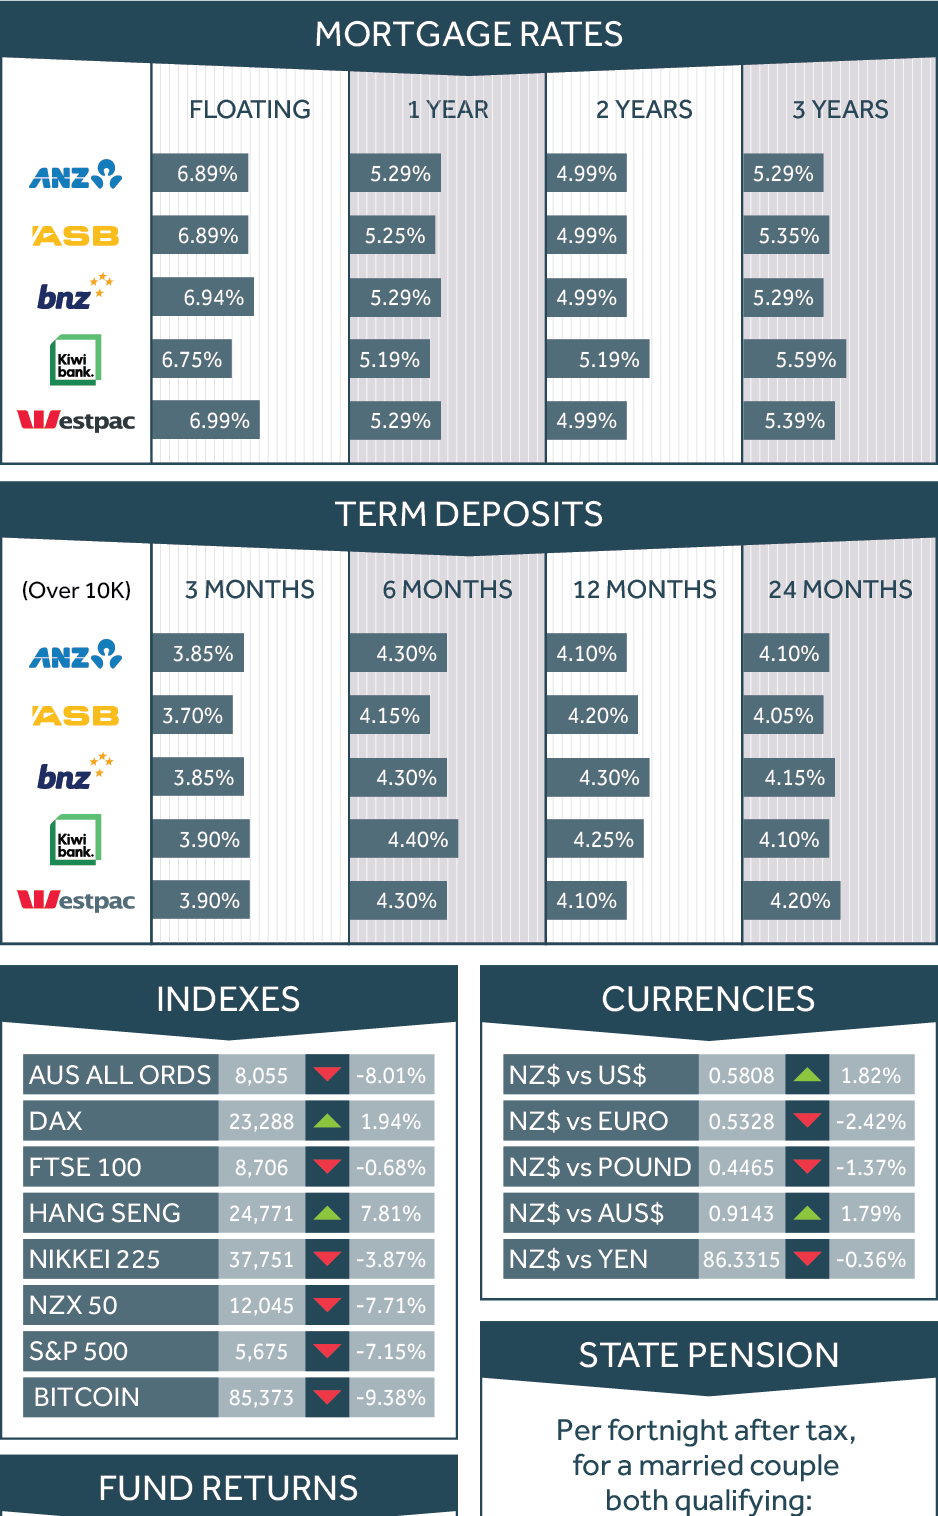
The old adage that past returns are no guarantee of future returns must be emphasized here, but there is some comfort in the above facts. I have no idea if we are at the bottom of the market or still have a long way to go. But I do know that over the long term, a good financial plan and a well constructed portfolio which is consistent with your risk tolerance, will achieve your financial goals. That's the only thing I'm focused on. In terms of the share markets, the past month has been extremely volatile in most cases (as we've just discussed). The exception is Hong Kong's Hang Seng (a proxy for the Chinese market) which is up nearly 8%. An interesting outcome from the trade wars is the relative weakness in the USA market compared to Asia and Europe - a trend I'll be keeping an eye on in the coming months. Mortgage and term deposit rates continue to decline. You can now get a mortgage for under 5% again - the first time since June 2022. Foreign exchange rates are mixed, and house prices continue to decline. Here are the numbers: |
||||||||||||||||||||||||||||||||||
|
||||||||||||||||||||||||||||||||||
In terms of your Select Wealth Management portfolio, you will be receiving your March quarterly performance reports soon. It has obviously been a tough quarter, and there are still 8 trading days left. As we've just learned, a lot can happen in 8 days - positive or negative. So I won't hazard a guess on what the end outcome will be by 31 March. However, as it stands, we are currently down between 1% (Conservative portfolio) and 3% (Growth portfolio) for the quarter. Finally, a quick update on the Giving Back campaign. So far we have raised $700 for our campaign for Lower Hutt Woman's Refuge. As always, thank you for the referral of family and friends which enables us to continue this initiative. To keep track of the Giving Back program visit https://mifinancialplanning.co.nz/giving-back.html to learn more in the meantime. That's all for now. Chat again soon Warm regards Dave and the team at Makowem & Isaacs Financial Planning dave@mifinancialplanning.co.nz |
||||||||||||||||||||||||||||||||||
 |
||||||||||||||||||||||||||||||||||
This newsletter is intended for general distribution and does not constitute personal financial advice.


